State-wise solar PV potential of India (ground mounted)
Author: PPD Team Date: October 10, 2025


Author: PPD Team Date: October 10, 2025
According to the National Institute of Solar Energy (NISE) under the Ministry of New and Renewable Energy (MNRE), India’s total ground-mounted solar PV potential is estimated at 3343.37 GWp as of September 2025. Rajasthan leads with the highest potential at 828.78 GWp, followed by Jammu & Kashmir (including Ladakh) with 486.68 GWp, and Maharashtra with 318.97 GWp. Other states with significant potential include Madhya Pradesh (299.31 GWp), Andhra Pradesh (243.22 GWp), Gujarat (223.28 GWp), and Karnataka (204.77 GWp). Southern and western states together account for a major share of the national potential, while smaller states and Union Territories like Goa, Sikkim, and Daman & Diu have limited capacities below 1 GWp. This data highlights India’s vast solar energy potential across diverse geographic regions.
Source: Solar PV Potential of India (Ground Mounted), National Institute of Solar Energy (NISE), Ministry of New and Renewable Energy (MNRE), Government of India, September 2025.

Author: PPD Team Date: July 29, 2025 A total of 2.41 crore smart meters have been installed across 28 states and union territories under the Revamped Distribution Sector Scheme (RDSS) as of 15 July 2025, out of the 20.33 crore meters sanctioned. In Gujarat, 1.67 crore meters have been approved under the scheme, with 20.94 lakh already installed. According to state utilities, installation is in the early stages, and division-wide coverage is ongoing. Any improvement…

Author: PPD Team Date: August 14, 2025 The table below shows peak demand and average demand of electric power in the country during the last three years (All figures in MW). Source: Rajya Sabha questions
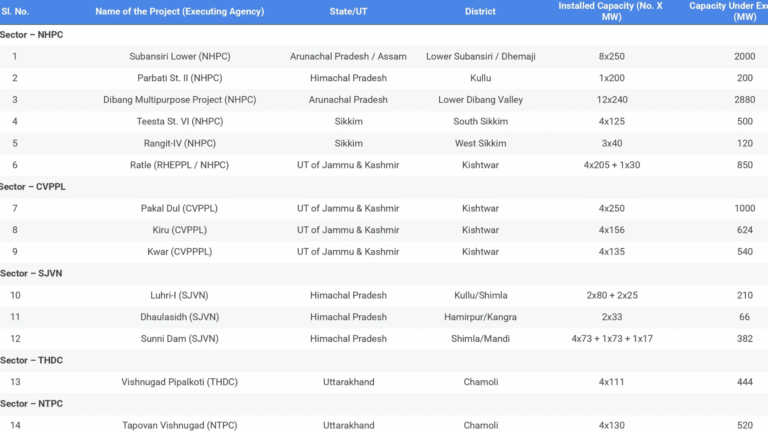
Author: PPD Team Date: April 18, 2025 List of Hydro Electric Projects (above 25 MW) -under implementation India has 26 hydroelectric projects (HEPs) with a total capacity of 13,238 MW that are under construction. Currently, there are 209 operational HEPs with a combined installed capacity of 42,983 MW. Some projects like Teesta-III, Teesta-V, Khandong, and Malana-II are generating less or no power due to flash floods and cloudbursts, causing outages. Developers are working on improving…

Author: PPD Team Date: August 27, 2025 Smart Metering & RDSS Update (latest figures): Overall smart meters installed: 3.78 crore Prepaid smart meters: 1.22 crore Financial sanction under RDSS: Rs 2.82 lakh crore for 32 States/UTs (includes smart metering and other infra works) State-wise total sanctioned costs under RDSS: Source: Rajya Sabha answers
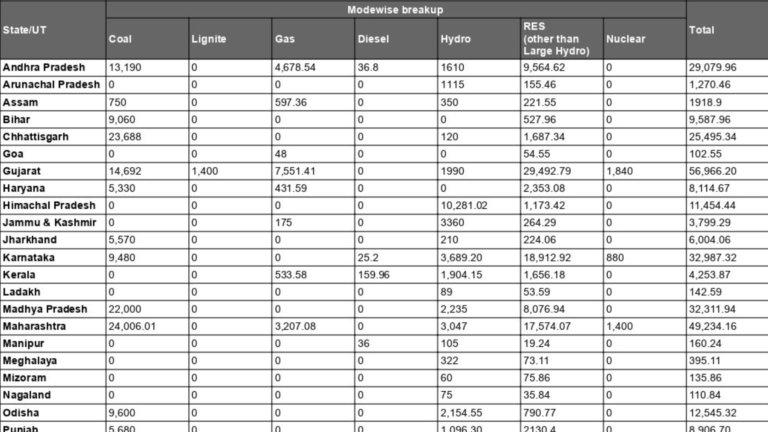
Author: PPD Team Date: February 20, 2025 The following table presents a detailed state and Union Territory-wise breakdown of India’s power generation capacity as of December 31, 2024, categorized by energy sources (All figures in MW): The following table presents a detailed state and Union Territory-wise breakdown of India’s installed renewable energy capacity as of December 31, 2024 (All figures in MW): Source: Rajya Sabha answers
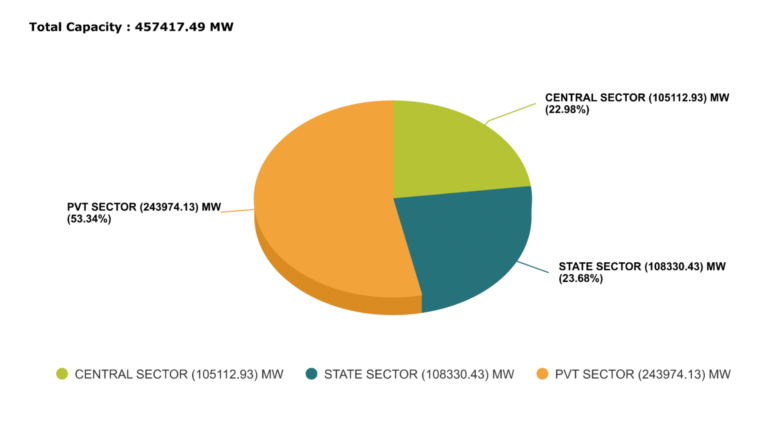
Author: PPD Team Date: January 6, 2025 India’s total installed power generation capacity surged by 83.8%, increasing from 249 GW as of March 31, 2014, to 457 GW as of November 30, 2024. Here are the highlights of the power generation sector in 2024: Renewable Energy Expansion Since April 2014, 129 GW of renewable energy capacity, including large hydro, has been added. This includes: 91 GW of solar power 27 GW of wind power 3.2…