State-wise total sanctioned costs under RDSS
Author: PPD Team Date: August 27, 2025


Author: PPD Team Date: August 27, 2025
Smart Metering & RDSS Update (latest figures):
Overall smart meters installed: 3.78 crore
Prepaid smart meters: 1.22 crore
Financial sanction under RDSS: Rs 2.82 lakh crore for 32 States/UTs (includes smart metering and other infra works)
State-wise total sanctioned costs under RDSS:
Source: Rajya Sabha answers
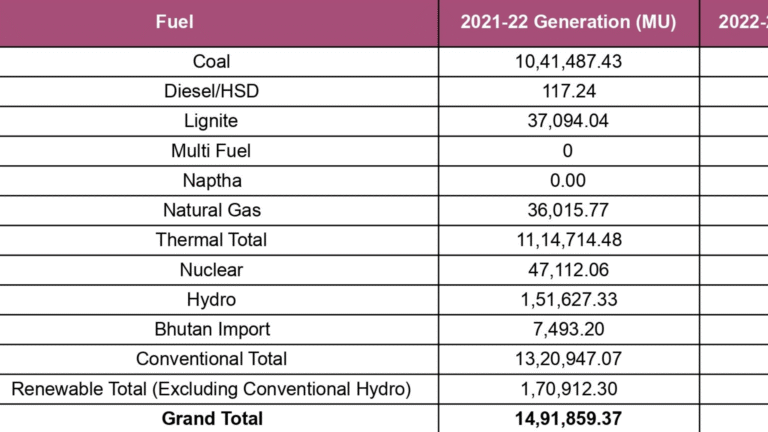
Author: PPD Team Date: June 24, 2025 Details of Electricity Generated from Various Sources/Fuels (2021–22 to 2024–25 up to Feb 2025) (All figures are in Million Units) Soucre: Lok Sabha Answers

Author: PPD Team Date: April 7, 2025 This information has been given by the Union Minister for Power and New & Renewable Energy Shri R. K. Singh, in a written reply to a question, in Lok Sabha.
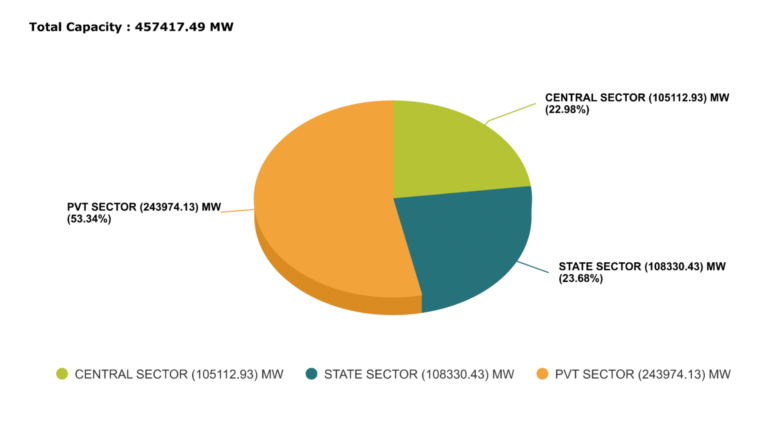
Author: PPD Team Date: January 6, 2025 India’s total installed power generation capacity surged by 83.8%, increasing from 249 GW as of March 31, 2014, to 457 GW as of November 30, 2024. Here are the highlights of the power generation sector in 2024: Renewable Energy Expansion Since April 2014, 129 GW of renewable energy capacity, including large hydro, has been added. This includes: 91 GW of solar power 27 GW of wind power 3.2…
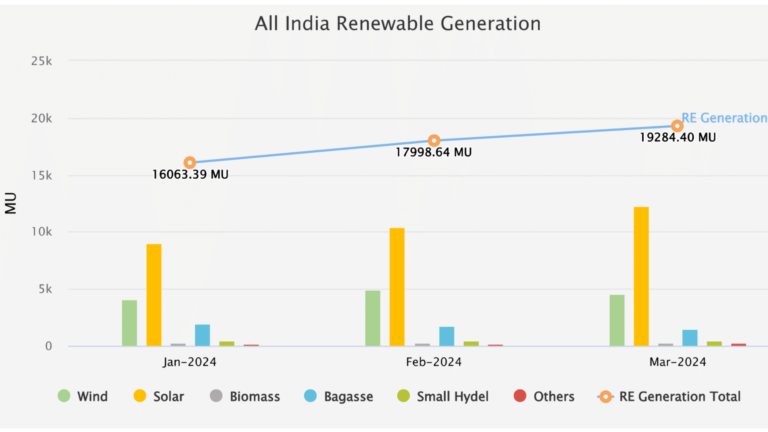
Author: PPD Team Date: January 6, 2025 Year-End Review: India’s Renewable Energy Progress in 2024 By November 2024, India had a total non-fossil fuel capacity of 214 GW, an increase of over 14% from the 187.05 GW recorded during the same period in 2023. From April to November 2024, India added nearly 15 GW of renewable energy, nearly doubling the 7.57 GW added in the same months of 2023. PM-Surya Ghar: Muft Bijli Yojana Launched…

Author: PPD Team Date: December 24, 2025 India’s power sector continues to expand with a total installed utility capacity of 509,743.09 MW as of November 30, 2025, according to the latest data from the Central Electricity Authority (CEA). Thermal power remained the largest contributor with an installed capacity of 246,941.62 MW, accounting for 48.5 percent of the total. Renewable energy followed closely at 254,021.47 MW, representing 49.9 percent of installed capacity. Hydro power capacity stood…
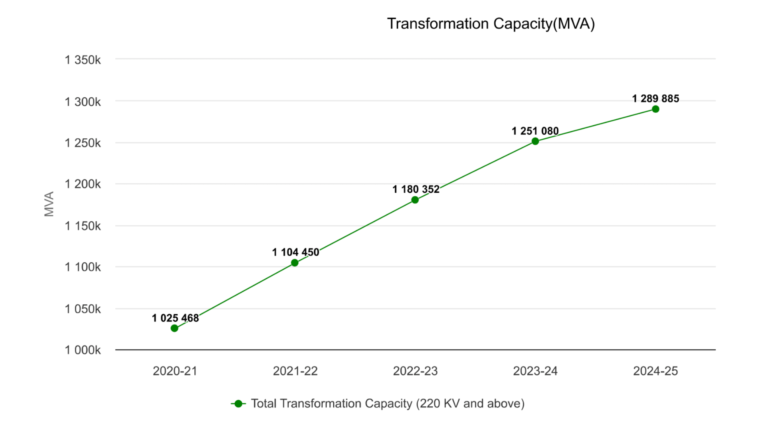
Author: PPD Team Date: January 6, 2025 Year-end review: Power transmission and distribution in India National Electricity Plan 2023-2032 The Government of India has finalized the National Electricity Plan for the period 2023-2032 to address a projected peak demand of 458 GW by 2032, with an estimated total investment of Rs 9.15 trillion. In the new plan, the transmission network will grow from 491,000 ckm in 2024 to 648,000 ckm by 2032, while transformation capacity…